..
analyzing my reading statistics
Tracking my data has always helped me keep up good habits. For books, I use Goodreads, despite the sometimes borderline unusable interface and a questionable color scheme.
I decided to export my library and dig into my reading data a little bit. I used Jupyter Notebooks and Python (mainly pandas and matplotlib). The notebook is here.
Interesting insights:
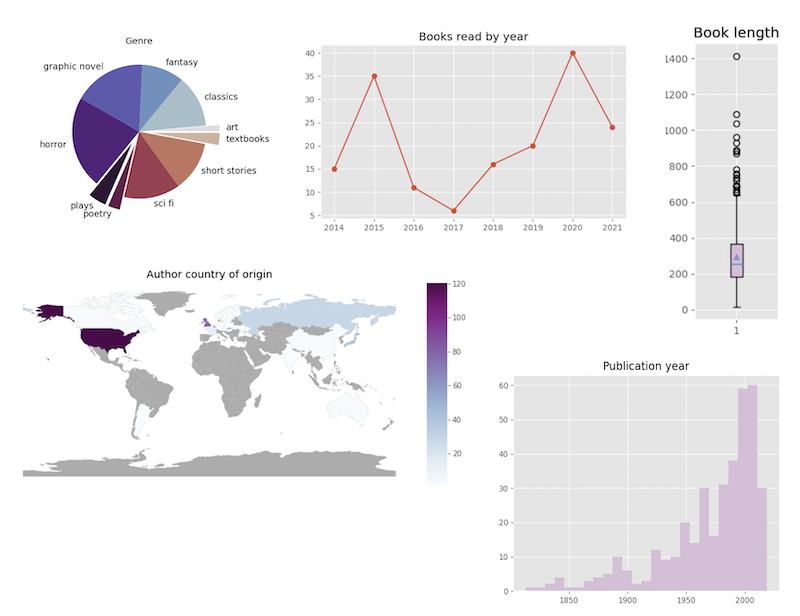
- Some genres to explore that I haven’t read much: history, philosophy and poetry.
- I have a pretty clear bias in my author countries (I’m reading a bit more German-speaking authors in German now)
- Publication year had to be cut off, because reading some Greek tradegies messes up the axes. Still, I’m surprised at how many “modern” (e.g. post 1950s) books I read.
- It’s not very straightforward to find the gender of authors - would be interesting to look at the distribution as well.
Some things I found and learned along the way:
- Pandas has a ‘to_datetime’ method that allows for extraction of any part of the date and other such operations (file that under ‘no need to reinvent the wheel’). The downloaded data had pretty wonky reading statistics (date read was recorded correctly on the website, but not in the CSV), so I ended up not using it as much.
- Python has a ‘requests’ package that deals with APIs, it’s actually fairly simple to use. I tried to use the OpenLibrary API to find the book genre, but since it doesn’t provide it, I had to use my existing shelves.
- Matplotlib has a lot of good looking color schemes.
- I used the Wikidata API to find the country of origin: the description of most authors had their nationality first. If it didn’t, I discarded it. I used a list of demonyms to convert this to country. Kind of convoluted, but it worked.
- Geopandas can be used to plot geographical data - I used Counter to count up the countries, converted this dict to a data frame and then to a Geopandas data frame (side note: Geopandas did not work without its own dedicated environment)